When betting on professional sports, like the MLB, it’s important to keep in mind that the variables that impact a bet are going to be different for each sport. In this article, we’re going to go over how to use Park Factors when betting on MLB games.
New to betting? Read our Beginner’s Guide to Betting with a glossary of terms
What are Park Factors?
Put simply: park factors tell us which stadiums are more likely to promote or prevent run-scoring.
Unlike really any other sport, the stadium or park in baseball is exceptionally important because each park has different measurements, which means that the game environment can drastically different in each park.
Park Factors isolate the impact of the park which helps us to more accurately determine the outcomes for players and games. Most places that create Park Factors measurements will take into account the physical properties of the stadiums (the distance or height of the fences, the amount of foul ground, etc.). They will also factor in changes to the stadiums (like Baltimore moving back and raising their left field fence this year), and, lastly, Park Factors will consider things like altitude, which allows the baseball to carry farther in the thin air and is why Coors Field in Colorado is so friendly to offense.
How Should You Use Park Factors?
Before you bet on any MLB game, it’s important to check where the game is being played. That seems obvious, but often we don’t take it into account enough. When we see a game in an offense-friendly park, we need to think about how that impacts the over/under. However, it goes deeper than that.
As you’ll see below, some parks are better for offense because they have big outfields and thus more baseballs drop in for hits and doubles. However, other ballparks are better for offense because their fences are short, which means more home runs are hit there. Depending on who the pitcher is, this may impact them in different ways.
If you see a pitcher who has a poor HR/9, meaning he gives up a lot of home runs per every nine innings, then that pitcher, and thus his team, will be more impacted by a smaller park. Yet, if you see another pitcher who has a 60% groundball rate, meaning he doesn’t allow many hitters to hit the ball in the air, he would be less impacted by those Park Factors, which could help us to sneak in an under bet.
Park Factor Leaderboards
Below you’ll see the various leaderboards for Park Factors. These are based on years of data, so they won’t really be impacted drastically by a few weeks of 2022 data. As a result, you can use this page whenever you are placing your bets during the season.
Park Factor – Home Runs
| RANK | PARK | TEAM | HR |
|---|---|---|---|
| 1 | Guaranteed Rate Field | White Sox | 1.23 |
| 2 | Great American Ball Park | Reds | 1.21 |
| 3 | American Family Field | Brewers | 1.18 |
| 4 | Yankee Stadium | Yankees | 1.18 |
| 5 | Dodger Stadium | Dodgers | 1.16 |
| 6 | Angel Stadium of Anaheim | Angels | 1.14 |
| 7 | Coors Field | Rockies | 1.13 |
| 8 | Rogers Centre | Blue Jays | 1.11 |
| 9 | Citizens Bank Park | Phillies | 1.09 |
| 10 | T-Mobile Park | Mariners | 1.06 |
| 11 | Wrigley Field | Cubs | 1.04 |
| 12 | Petco Park | Padres | 1.03 |
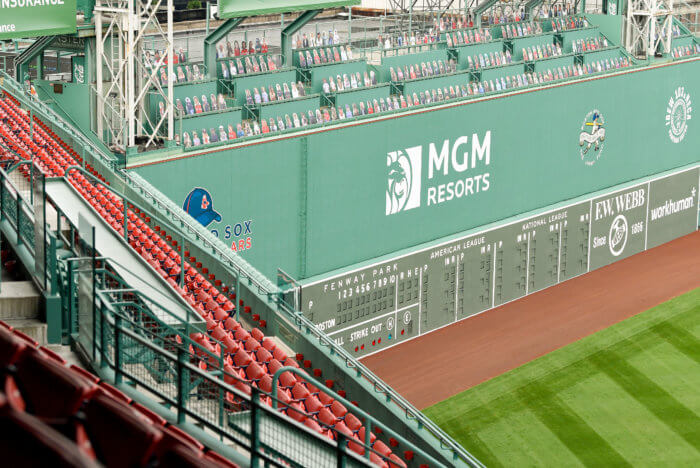
| 13 | Fenway Park | Red Sox | 1.02 |
| 14 | Progressive Field | Indians | 1.02 |
| 15 | Nationals Park | Nationals | 1.02 |
| 16 | Minute Maid Park | Astros | 1.00 |
| 17 | Citi Field | Mets | 0.99 |
| 18 | Truist Park | Braves | 0.97 |
| 19 | Globe Life Field | Rangers | 0.96 |
| 20 | Oriole Park at Camden Yards | Orioles | 0.95 |
| 21 | Target Field | Twins | 0.94 |
| 22 | Tropicana Field | Rays | 0.92 |
| 23 | LoanDepot Park | Marlins | 0.91 |
| 24 | Busch Stadium | Cardinals | 0.90 |
| 25 | PNC Park | Pirates | 0.83 |
| 26 | Comerica Park | Tigers | 0.83 |
| 27 | Kauffman Stadium | Royals | 0.80 |
| 28 | Chase Field | Diamondbacks | 0.80 |
| 29 | Oakland Coliseum | Athletics | 0.80 |
| 30 | Oracle Park | Giants | 0.78 |
To learn about betting in general, not just on MLB, read our Beginner’s Guide to Betting
Park Factor – Statcast Park Factor
Taken from MLB Statcast, this measurement is a combination of all the measurements for offensive hitting categories “to show the observed effect of each displayed stat based on the events in the selected park.”
*Globe Life (Texas Rangers) is not included here because there haven’t been three years of data
| Rk. | Venue | TEAM | Park Factor |
|---|---|---|---|
| 1 | Coors Field | Rockies | 114 |
| 2 | Fenway Park | Red Sox | 107 |
| 3 | Great American Ball Park | Reds | 106 |
| 4 | Oriole Park at Camden Yards | Orioles | 105 |
| 5 | Nationals Park | Nationals | 104 |
| 6 | Citizens Bank Park | Phillies | 103 |
| 7 | Truist Park | Braves | 103 |
| 8 | Angel Stadium | Angels | 102 |
| 9 | Chase Field | Diamondbacks | 101 |
| 10 | Kauffman Stadium | Royals | 101 |
| 11 | Progressive Field | Guardians | 101 |
| 12 | Minute Maid Park | Astros | 100 |
| 13 | Guaranteed Rate Field | White Sox | 100 |
| 14 | American Family Field | Brewers | 99 |
| 15 | PNC Park | Pirates | 99 |
| 16 | Dodger Stadium | Dodgers | 99 |
| 17 | Yankee Stadium | Yankees | 98 |
| 18 | Target Field | Twins | 98 |
| 19 | Citi Field | Mets | 98 |
| 20 | Comerica Park | Tigers | 98 |
| 21 | Wrigley Field | Cubs | 98 |
| 22 | Rogers Centre | Blue Jays | 98 |
| 23 | loanDepot park | Marlins | 97 |
| 24 | Petco Park | Padres | 95 |
| 25 | Oracle Park | Giants | 95 |
| 26 | Tropicana Field | Rays | 95 |
| 27 | T-Mobile Park | Mariners | 94 |
| 28 | Busch Stadium | Cardinals | 94 |
| 29 | Oakland Coliseum | Athletics | 94 |
Park Factor – Runs
*Globe Life (Texas Rangers) is not included here because there haven’t been three years of data
| Rk. | Venue | TEAM | R |
|---|---|---|---|
| 1 | Coors Field | Rockies | 130 |
| 2 | Fenway Park | Red Sox | 114 |
| 3 | Great American Ball Park | Reds | 112 |
| 4 | Oriole Park at Camden Yards | Orioles | 110 |
| 5 | Nationals Park | Nationals | 108 |
| 6 | Citizens Bank Park | Phillies | 106 |
| 7 | Truist Park | Braves | 106 |
| 8 | Angel Stadium | Angels | 104 |
| 9 | Chase Field | Diamondbacks | 102 |
| 10 | Kauffman Stadium | Royals | 102 |
| 11 | Progressive Field | Guardians | 102 |
| 12 | Minute Maid Park | Astros | 100 |
| 13 | Guaranteed Rate Field | White Sox | 100 |
| 14 | American Family Field | Brewers | 98 |
| 15 | PNC Park | Pirates | 98 |
| 16 | Dodger Stadium | Dodgers | 98 |
| 17 | Yankee Stadium | Yankees | 96 |
| 18 | Target Field | Twins | 96 |
| 19 | Citi Field | Mets | 96 |
| 20 | Comerica Park | Tigers | 96 |
| 21 | Wrigley Field | Cubs | 96 |
| 22 | Rogers Centre | Blue Jays | 96 |
| 23 | loanDepot park | Marlins | 94 |
| 24 | Petco Park | Padres | 90 |
| 25 | Oracle Park | Giants | 90 |
| 26 | Tropicana Field | Rays | 90 |
| 27 | T-Mobile Park | Mariners | 88 |
| 28 | Busch Stadium | Cardinals | 88 |
| 29 | Oakland Coliseum | Athletics | 88 |
Park Factor – wOBA
wOBA stands for weighted On-Base Average: We like it better than standard batting average because it weights the impact of the types of hits recorded at the park.
According to MLB.com, “wOBA is a version of on-base percentage that accounts for how a player reached base — instead of simply considering whether a player reached base. The value for each method of reaching base is determined by how much that event is worth in relation to projected runs scored (example: a double is worth more than a single).”
| RANK | PARK | TEAM | wOBA |
|---|---|---|---|
| 1 | Guaranteed Rate Field | White Sox | 1.01 |
| 2 | Great American Ball Park | Reds | 1.04 |
| 3 | American Family Field | Brewers | 1.01 |
| 4 | Yankee Stadium | Yankees | 1.00 |
| 5 | Dodger Stadium | Dodgers | 1.01 |
| 6 | Angel Stadium of Anaheim | Angels | 1.00 |
| 7 | Coors Field | Rockies | 1.13 |
| 8 | Rogers Centre | Blue Jays | 1.00 |
| 9 | Citizens Bank Park | Phillies | 0.99 |
| 10 | T-Mobile Park | Mariners | 0.97 |
| 11 | Wrigley Field | Cubs | 1.02 |
| 12 | Petco Park | Padres | 0.97 |
| 13 | Fenway Park | Red Sox | 1.05 |
| 14 | Progressive Field | Indians | 1.02 |
| 15 | Nationals Park | Nationals | 0.99 |
| 16 | Minute Maid Park | Astros | 0.98 |
| 17 | Citi Field | Mets | 0.96 |
| 18 | Truist Park | Braves | 1.00 |
| 19 | Globe Life Field | Rangers | 1.00 |
| 20 | Oriole Park at Camden Yards | Orioles | 0.99 |
| 21 | Target Field | Twins | 1.00 |
| 22 | Tropicana Field | Rays | 0.97 |
| 23 | LoanDepot Park | Marlins | 0.98 |
| 24 | Busch Stadium | Cardinals | 0.97 |
| 25 | PNC Park | Pirates | 1.00 |
| 26 | Comerica Park | Tigers | 1.00 |
| 27 | Kauffman Stadium | Royals | 1.01 |
| 28 | Chase Field | Diamondbacks | 1.00 |
| 29 | Oakland Coliseum | Athletics | 0.95 |
| 30 | Oracle Park | Giants | 0.99 |
Park Factor Websites
You can choose the sites you trust the most; however, for us, we like to use:
